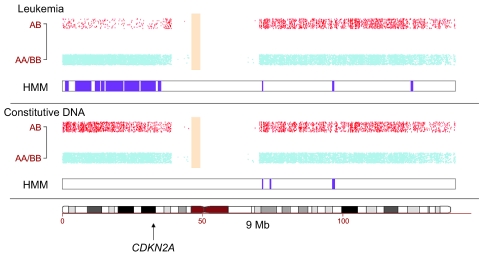
Figure 3. SNP array analysis shows LOH.
A genome-wide SNP array was used to examine gross deletions or rearrangements within the patient’s chromosomes. Signal from the array showing homozygosity (AA/BB) and heterozygosity (AB) of alleles on each chromosome are shown by blue or red dots, respectively. Strikingly, analysis of chromosome 9 revealed a LOH of a large region of the short arm in leukemia cells (top panel) when compared with DNA from pre–gene therapy cells (middle panel). LOH as identified by a hidden Markov model (HMM) is represented graphically in purple to show the area altered between constitutive and leukemic DNA. The tumor suppressor gene CDKN2A, which encodes p14(ARF1) and p16(INK4a), is located at 9p21, shown in the lower panel by an arrow. Alterations within this genomic locus are probably the cause for downregulation of CDKN2A expression (as described in Figure 2A).

