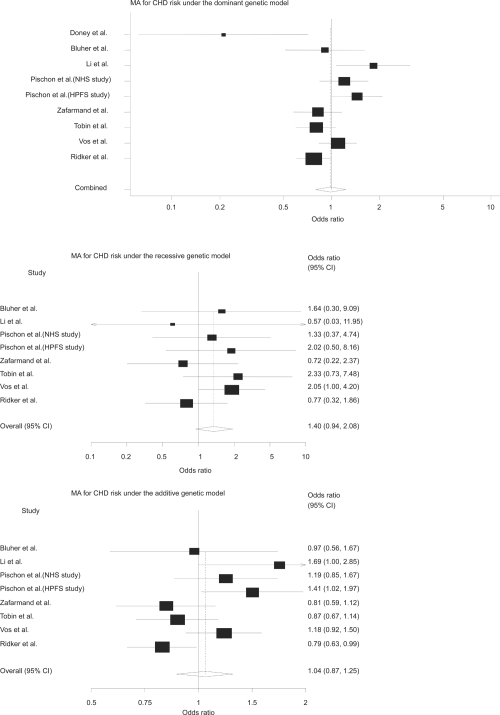
Figure 2. Meta-analyses of CHD risk under the different genetic models.
These forest plots show the overall odds ratio for 9 studies included in the meta-analysis under the dominant, recessive, and additive models respectively. Doney and colleagues (2004) did not provide data for recessive and additive models. Size of cubes represents weight of each study.

