
Figure 3.
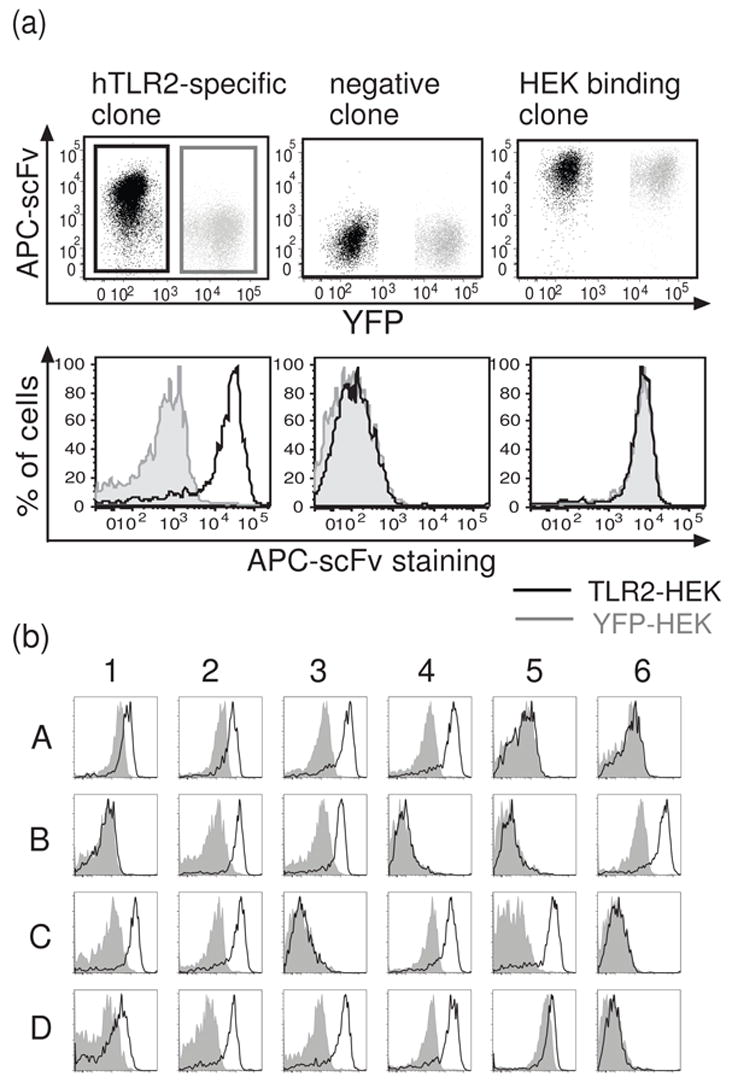
Flow cytometric screening of phage clones for binding to cell-surface hTLR2. (a) Representative scatter plots and histograms demonstrating typical results for hTLR2-specific clones (left), non-binding clones (center), and clones that bind to all HEK cells (right). Equal numbers of hTLR2-HEK and YFP-HEK cells were mixed and stained with raw phage preparations of individual clones. hTLR2-HEK cells (black gate) were distinguished from control YFP-HEK cells (gray gate) in the FITC channel as shown and the binding of phage to each population displayed as overlays of histograms (black line -hTLR2-HEK cells; gray shadow - YFP-HEK cells). (b) Typical results of flow cytometry-based screening. Results for 24 out of 96 wells in one screen of the cell-selected library are show. Histograms are formatted as in (a).