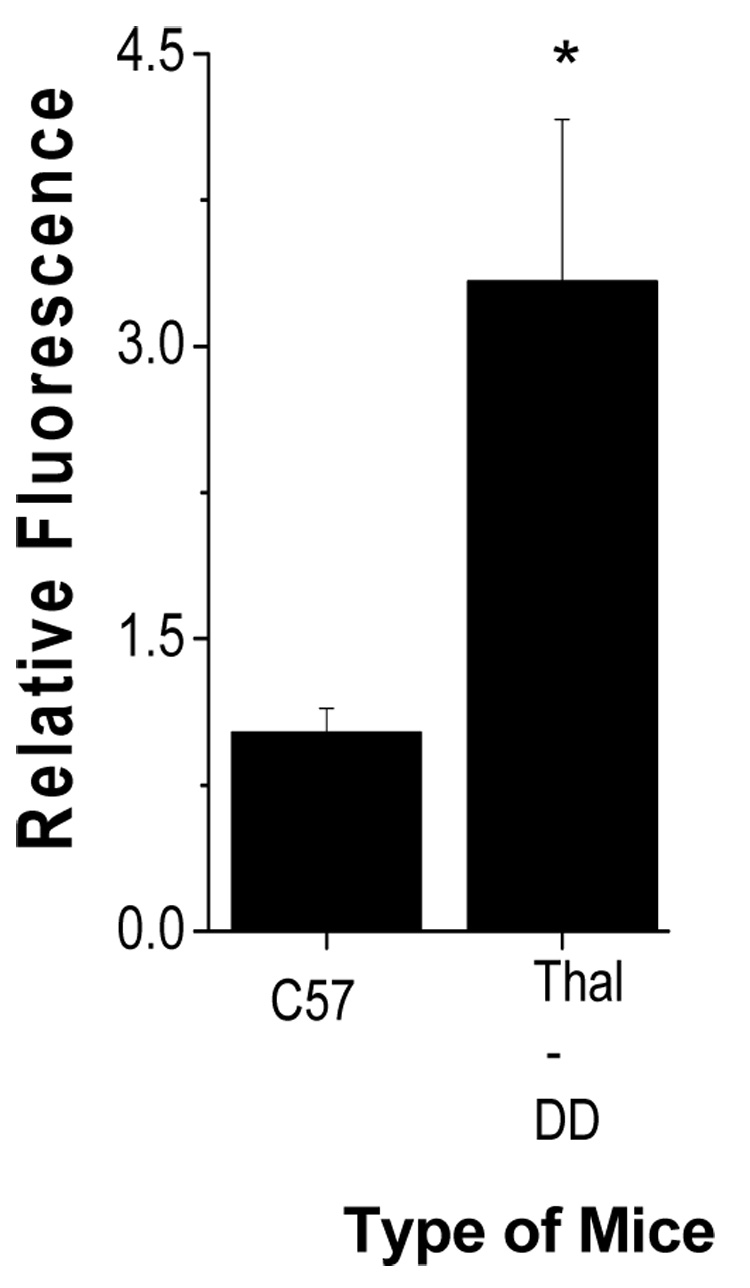
Fig. 1.

Heme degradation in thalassemic transgenic mice: Hemoglobin concentration of the hemolysate was adjusted to 50 µM and the fluorescence intensity was measured at ex 321 nm and em 480 nm. Details of the procedure used and the characterization of the mouse mutants are given in the Methods section and Table 1. Values are mean ± SD of 4 to 10 animals in each group ( control mice (C57) and thalassemic mice (dd)). *, p <0.001 relative to control.
