
Figure 2.
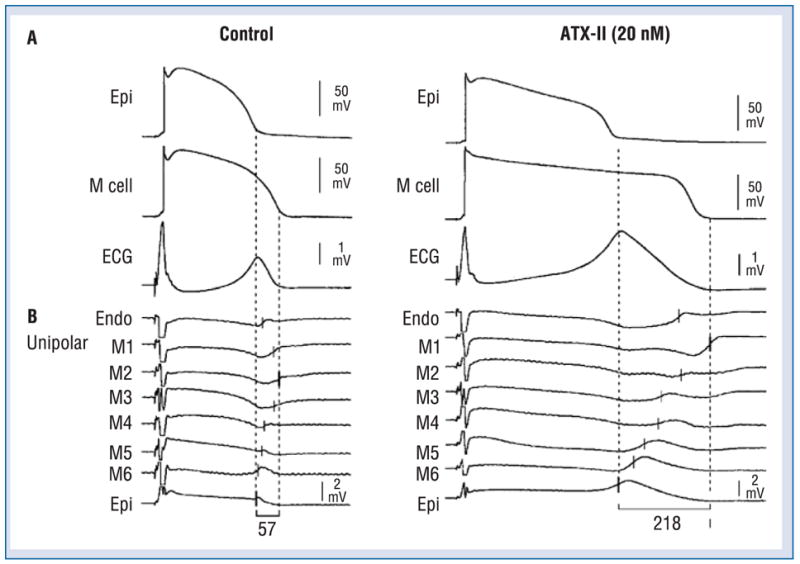
Electrocardiographic Tpeak–Tend interval as a measure of transmural dispersion of repolarization. The figure shows the correspondence among transmembrane, unipolar, and ECG recordings in the absence (left) and the presence (right) of ATX-II (20 nmol/L). Each panel shows: A. Transmembrane action potentials recorded from M (M2) and epicardial sites of a canine left ventricular wedge preparation together with a transmural ECG recorded across the bath (BCL of 2000 ms); B. Eight intramural unipolar electrograms recorded approximately 1.2 mm apart from endocardial (Endo), M (6 sites; M1–M6) and epicardial (Epi) regions (120 μm silver electrodes insulated except at the tip) inserted midway into the wedge preparation. Dashed vertical lines in the unipolar electrograms denote the time maximum of the first derivative (Vmax) of the T wave (ARI, end of activation-recovery interval). Close correspondence between the repolarization time of the cells deep within the wedge and those at the cut surface attest the uniformity of the electrical activity in the respective transmural layers. Modified from [2], with permission.