
Fig. 5.
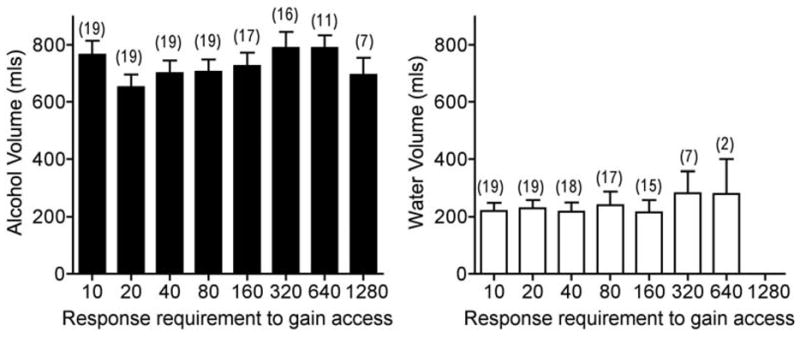
Total volume of alcohol (Left panel) and water (Right panel) consumed in Component 3 after completion of progressive ratio response requirements in Component 2. The opportunity to self-administer drinks in component 3 was contingent upon completion of the fixed ratio (FR) response requirement in component 2. The FR response requirement was increased each day (10, 20, 40, 80, 160, 320, 640 and 1280) until the response requirement was not met and no drinks were obtained that day. Each FR response requirement is shown on the x-axis. Each bar represents the group mean ± SEM volume consumed during sessions in which the response requirement was completed resulting in alcohol or water availability for self-administration. Numbers in parenthesis above each bar represent the number of sessions included in the mean (i.e., number of sessions in which the response requirement was completed). These data correspond to the mean BP determinations shown in Fig. 4.