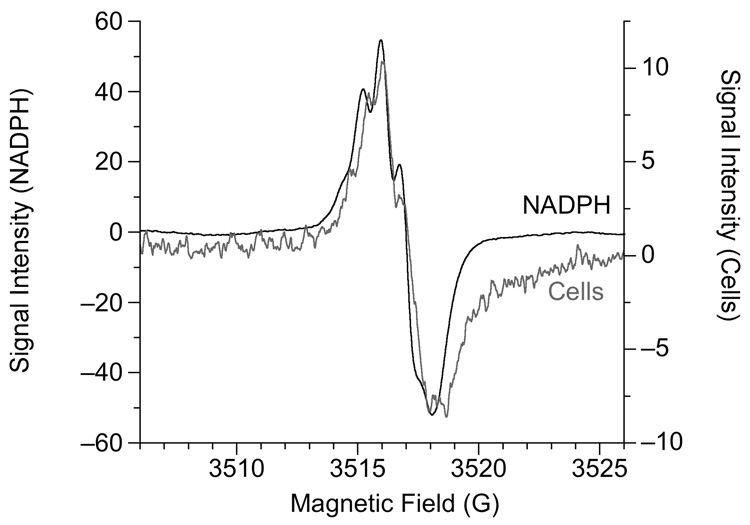
Fig. 8.
Hyperfine structure of the g = 1.979 Cr(V) ESR signal. The "Cells" spectrum was obtained following 5 min incubation of 107 cells at 37°C in 0.25 ml of LHC-medium containing 800 µM Na2CrO4. The "NADPH" spectrum was obtained following 30 min incubation of 5 mM NADPH plus 5 mM Na2CrO4 at 37°C in 0.3 ml 43.8 mM potassium phosphate buffer (pH 7.4). Instrument settings were: 0.1 G modulation amplitude, 50 mW microwave power, 6.32 × 10⁴ receiver gain, 327.68 msec time constant, 9.764 GHz microwave frequency, sweep width = 20 G, field set = 3516 G, modulation frequency = 100 kHz, scan time = 83.89 sec; conversion time = 81.92 msec. The number of scans was 5 and 50 for the "NADPH" and "Cells" samples, respectively. Note the different y-axis intensity scales for the two samples. The signals intensities were divided by 1000 to obtain the values on the graphs.

