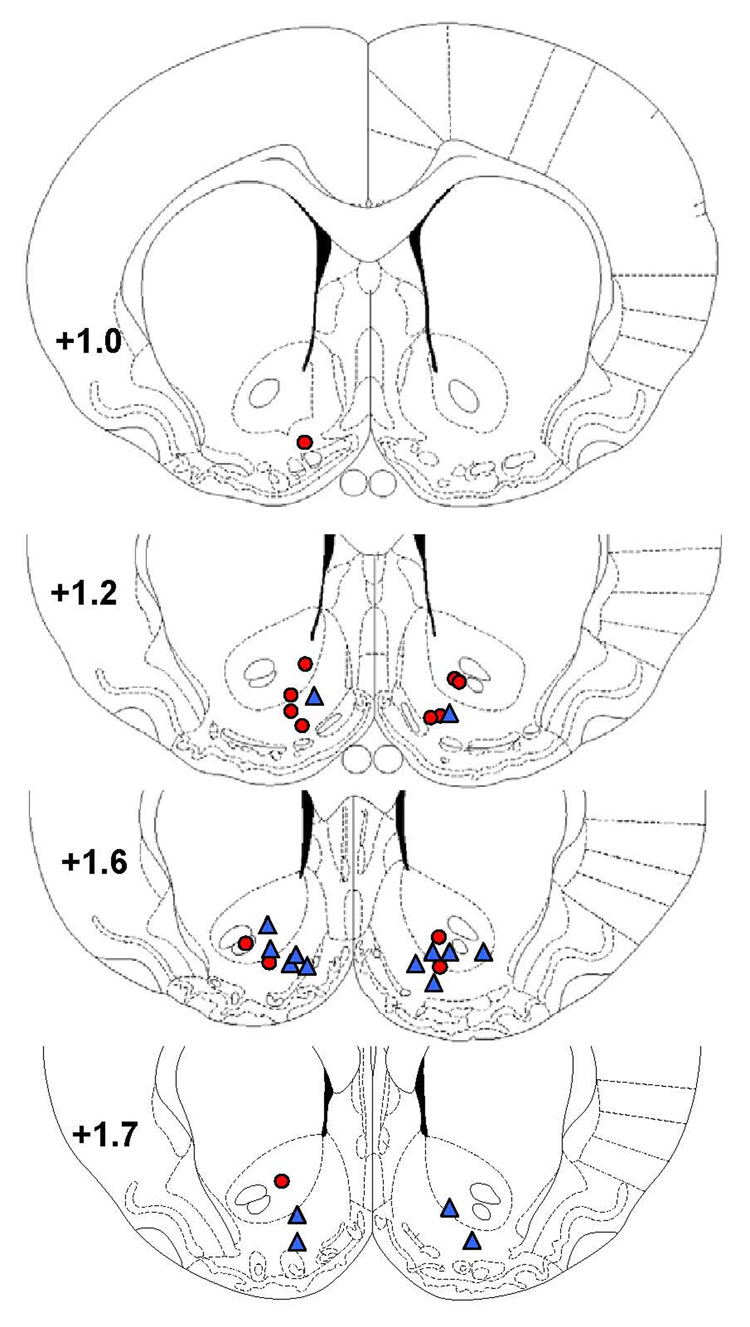
Figure 1.

Locations of the intra-NAcc injection sites are depicted on schematic drawings of coronal slices. Numbers represent mm from Bregma according to the atlas of Paxinos & Watson (1998). Injection sites in rats that completed the cocaine self-administration study are depicted by red circles. Injection sites in rats used in the food self-administration study are shown in blue triangles.
