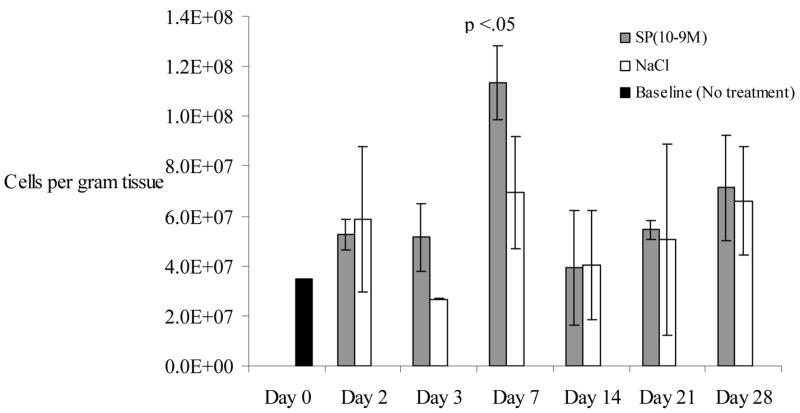
Figure 1.

Overall cell density (# cells/gram of wound tissue) is described in the y axis of the graph below. This represents the number of cells quantified per gram of tissue harvested. Cell density is compared in cutaneous wounds following treatment with substance P (10−9M) or NaCl. Cell density is transiently increased on days 3 and 7 following injury compared to normal saline treatment, with day 7 reaching statistical significance (p<0.05). “Day 0” represents the skin harvested during the wounding, with neither SP nor NaCl treatment. N=36 for this experiment. Error bars represent standard deviation.
