
Figure 2. Mesp1 Expression Is Sufficient to Induce Wnt-Independent Epithelial to Mesenchymal Transition.
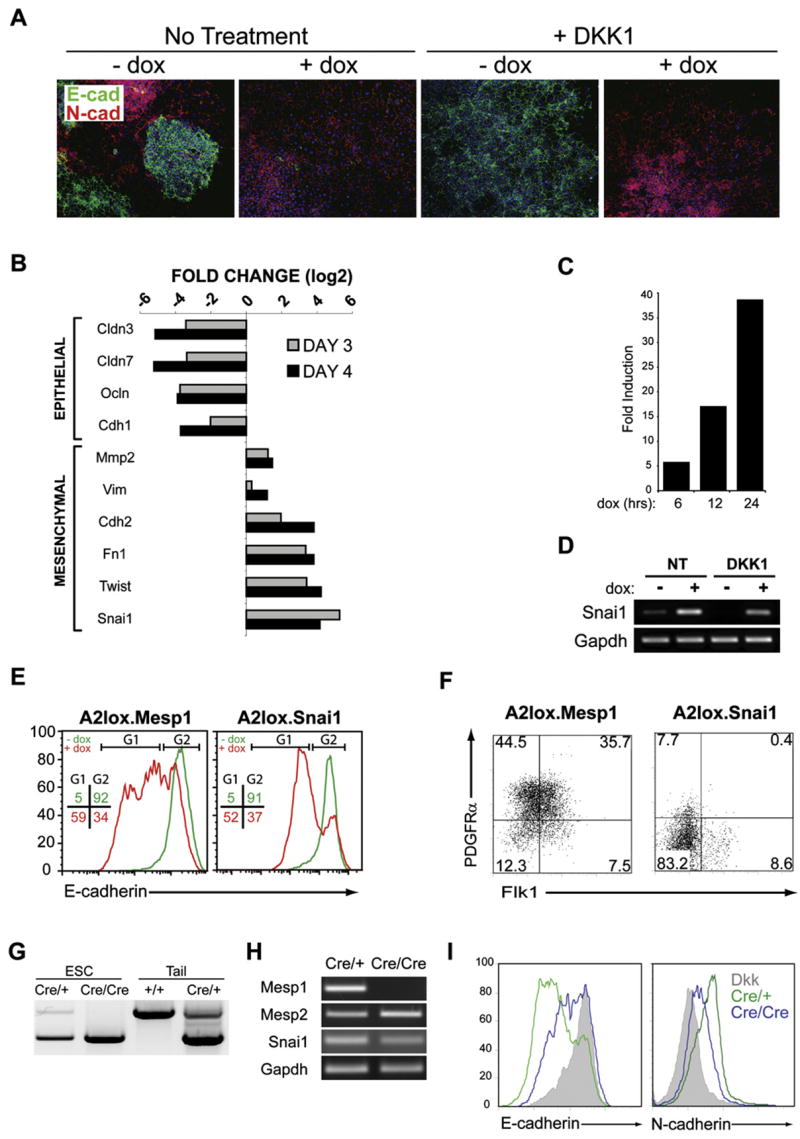
(A) A2lox.Mesp1 cells differentiated as described in Figure S1B were plated on day 2 onto Collagen I-coated slides and stained with antibodies to E-cadherin (green) and N-cadherin (red) on day 4. Nuclei were stained using Hoechst 33342 (blue).
(B) A2lox.Mesp1 cells were differentiated in the presence of DKK1, either with or without dox addition at day 2. On day 3 or day 4, gene expression was analyzed using Mouse Genome 430 2.0 arrays (Affymetrix). Shown are log2 fold change of expression of the indicated genes on day 3 (gray bar) and day 4 (black bar). Genes are arranged according to their association with either epithelial or mesenchymal phenotypes.
(C) Snai1 gene expression analysis at 6, 12, and 24 hr after Mesp1 induction. A2lox.Mesp1 cells were differentiated as in (B) and were harvested 6, 12, or 24 hr after dox addition, and gene expression was analyzed as in (B). Shown is the fold increase of Snai1 expression in cells treated with DKK1 and dox compared to timematched controls treated with DKK1 only.
(D) Snai1 and Gapdh expression were measured on day 3 of differentiation by RT-PCR. A2lox.Mesp1 ESCs were differentiated in the absence (NT) or presence of DKK1 (DKK1) beginning at day 2, either without (−) or with (+) addition of dox at day 2.
(E) A2lox.Mesp1 and A2lox.Snai1 ESCs differentiated as in (D) were analyzed on day 4 for E-cadherin levels by flow cytometry. Shown are histogram overlays of E-cadherin staining for each cell line treated with DKK1 alone (green) and DKK1 plus dox (red). Numbers represent the frequency of live-gated cells found within the indicated gates (G1 or G2) for DKK-treated (green) or DKK and dox-treated (red) cells.
(F) A2lox.Mesp1 and A2lox.Snai1 ESCs were treated with both DKK1 and dox. Cells were harvested on day 4 and analyzed by flow cytometry as in Figure 1.
(G) Mesp1 heterozygous or Mesp1-deficient ESCs were derived from blastocysts of crosses between Mesp1cre/+ heterozygous knockin mice. Heterozygous (Cre/+) or Mesp1-deficient (Cre/Cre) ESCs and wild-type (+/+) or heterozygous (Cre/+) mice were genotyped by PCR.
(H) Mesp1, Mesp2, Snai1, and Gapdh expression in heterozygous (Cre/+) or Mesp1-deficient (Cre/Cre) cells were measured by RT-PCR on day 5 of differentiation.
(I) Mesp1 heterozygous (green) or Mesp1-deficient (blue) ESCs, differentiated as embryoid bodies, were harvested on day 5. E-cadherin and N-cadherin levels, determined by flow cytometry, were compared to levels on DKK-treated cultures (shaded).