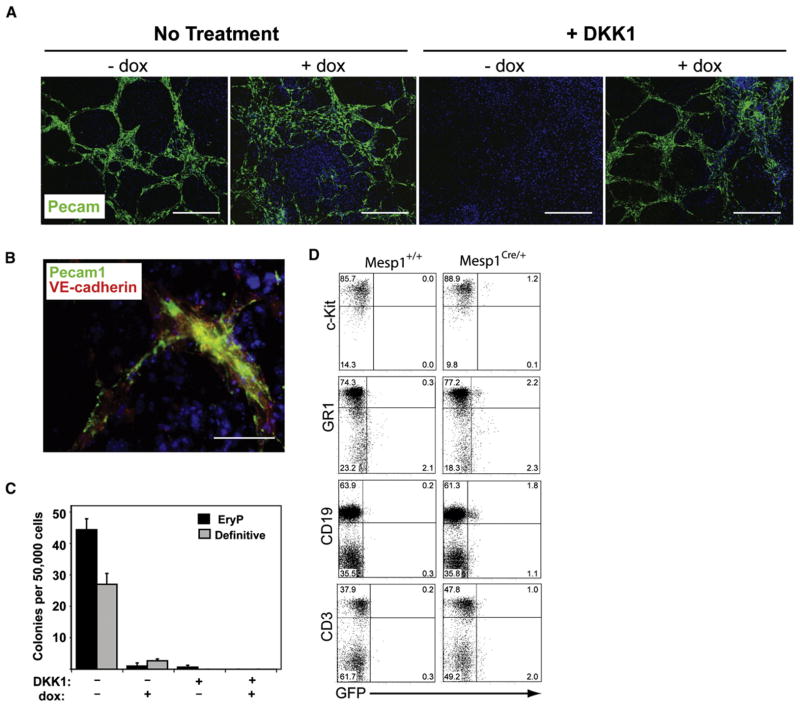
Figure 5. Mesp1 Expression Induces Endothelial Differentiation and Inhibits Hematopoietic Potential of Differentiating ESCs.
(A and B) A2lox.Mesp1 ESCs were differentiated as in Figure S1B and were plated on Collagen I-coated slides on day 4 of differentiation. On day 12, cells were stained with antibodies to Pecam1 (green) and VE-cadherin (red) as indicated. Nuclei were stained using Hoechst 33342 (blue). (A) Representative images are shown where the scale bar is 200 μm. (B) Higher power image (scale bar, 50 μm) of culture treated with both DKK1 (day 2–6) and dox (day 2–4). (C) A2lox.Mesp1 ESCs were differentiated as in Figure S1B. On day 6, cells were assessed for hematopoietic precursor potential using methycellulose colony forming assays. Primitive erythroid (black) and definitive hematopoietic (gray) colonies were counted at days 12 and 16, respectively. (D) Cells were obtained from adult Rosa R26R-eGFP+/−mice that were either Mesp1+/+ or Mesp1Cre/+. Bone marrow cells were analyzed by flow cytometry for GFP expression in cKithi lineage− live cells or Gr1+ cells contained in a granulocyte live-cell gate. Splenocytes were analyzed for GFP expression in either CD19+ or CD3+ cells contained in a lymphocyte live gate. Numbers shown are the percentage of live-gated cells in each quadrant.

