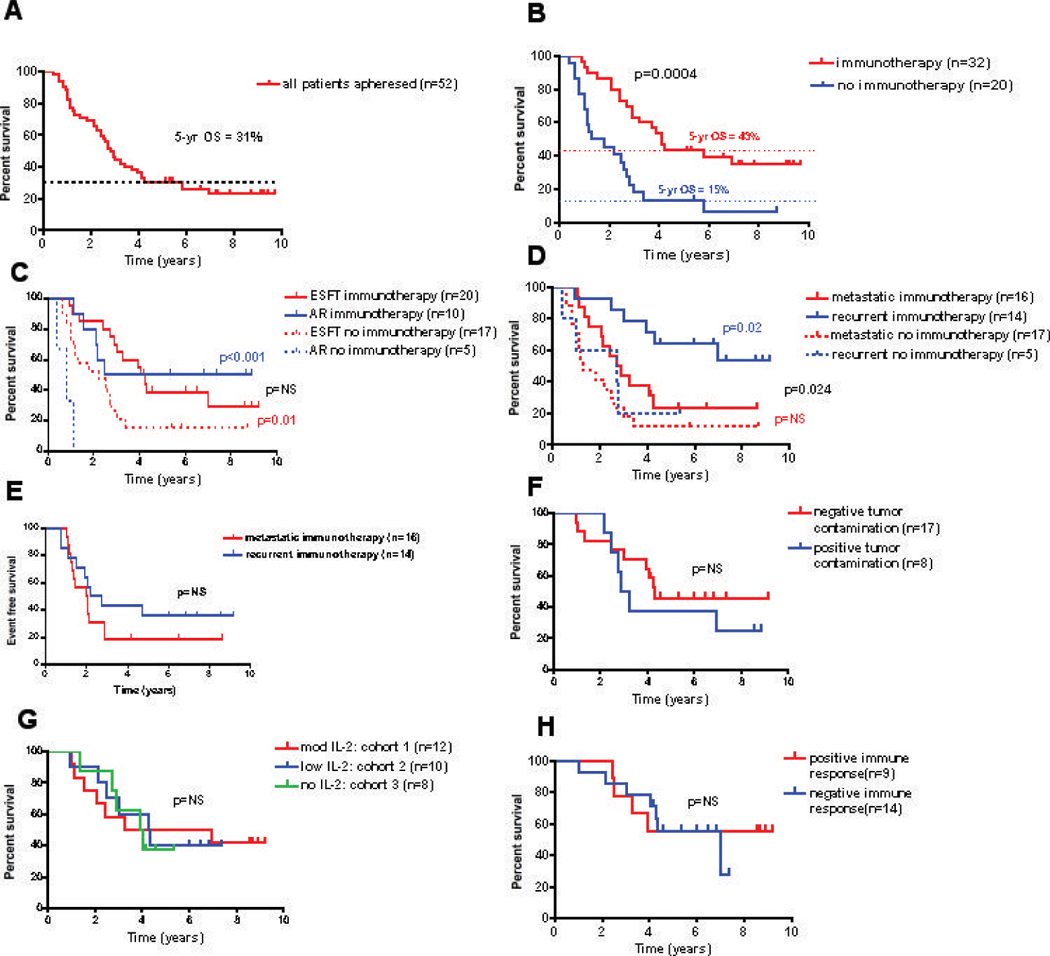
Figure 3.

Clinical Outcomes. Kaplan-Meier survival curves: (A) all patients who underwent apheresis (B) patients who initiated immunotherapy vs. those who did not (C) by diagnosis (D) by disease status at the time of apheresis (F) by tumor contamination of the autologous T cells (G) by immunotherapy cohort (H) by immune response to the immunizing peptide and (E) event free survival by disease status at enrollment.
