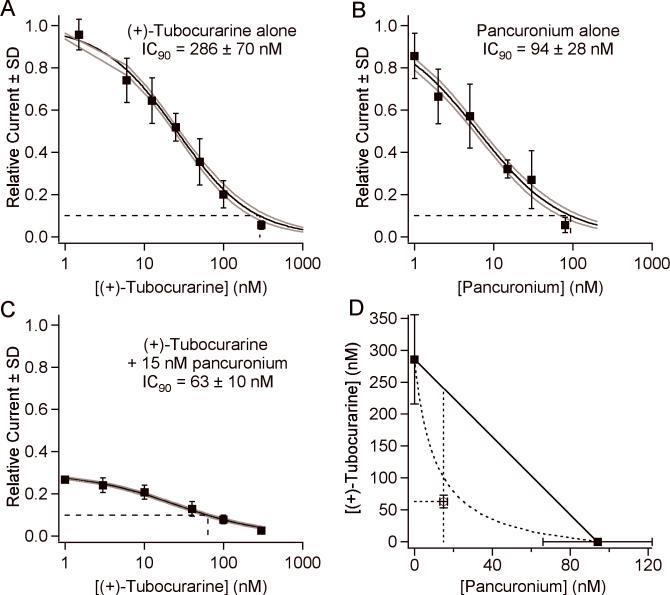
Fig. 3.
Our approach to determining the isobologram for combination of (+)-tubocurarine and pancuronium. (A) The concentration-response curve of (+)-tubocurarine alone. The solid line is the fit to Equation 1; the gray lines are ±1 SD of the fit. The dashed line indicates the IC90. (B) The concentration-response curve of pancuronium alone. (C) The concentration-response curve of (+)-tubocurarine in the presence of 15 nM pancuronium. (D) The isobologram of the combination of (+)-tubocurarine and pancuronium. The solid squares indicate the IC90 values of each antagonist alone and provide the endpoints for the line of additivity. The open square is drawn at [pancuronium]=15 nM and [(+)-tubocurarine]= its IC90 determined in the presence of 15 nM pancuronium. The dashed curve is an isobologram assuming that the antagonists bind exclusively to different sites.

