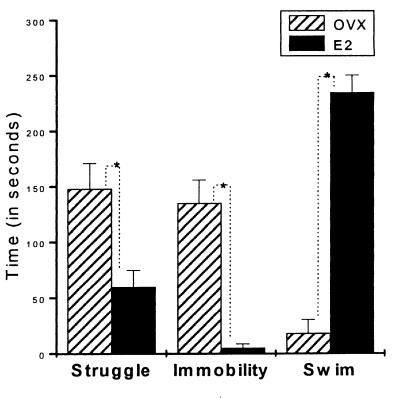
Figure 2.
FST (day 2). Each behavior was observed for 5 min. Bars represent the mean of the time the animals spent in each activity/posture. Ovx rats displayed significantly more struggling and immobility than those in the E2 group. E2 rats spent 20 times more time swimming than the Ovx controls. The variance in behavior for the Ovx animals has decreased, possibly caused by learning experience from the first day.

