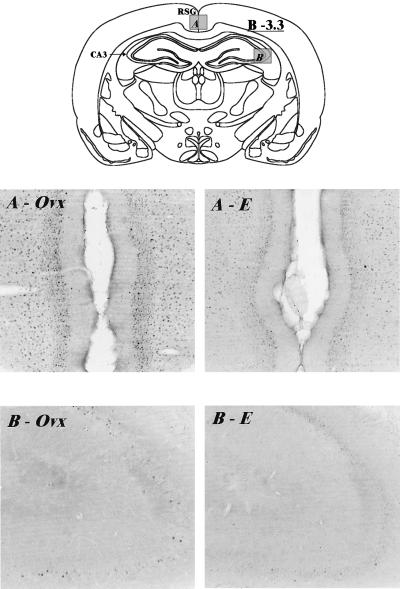
Figure 3.
Digitized images of c-fos immunoreactive cell nuclei taken from the retrosplenial cingulate gyrus (area A on the schematic) and the CA3 region of the hippocampus (area B on the schematic) of Ovx and E2 rats subjected to the FST. A illustrates the reduction in c-fos immunolabeling observed in the retrosplenial cingulate gyrus in the E2 rat (A–E) compared with the Ovx (A-Ovx) animal. Similar differences between hormonal conditions are seen in the CA3 region of the hippocampus in B. Bregma level −3.3 (12). Magnification: ×35. The diagrams used here and in Fig. 4 were taken from the Rat Brain Clipart Package (Neurographics, Kanata, Ontario, Canada).

