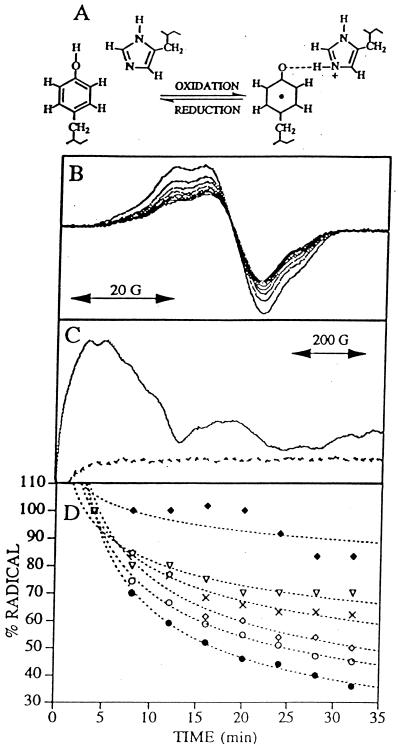
Figure 1.
(A) Schematic representation of a proton acceptor for the neutral tyrosine radical D•. (B) Tyrosine D• EPR spectra of manganese-depleted, wild-type PSII preparations recorded at pH 7.5 and −9°C. Samples were illuminated for 4 min, and successive spectra were recorded every 4 min after illumination to monitor the radical decay rate (solid lines). (C) Light-minus-dark EPR spectra of QA− Fe+2 in Synechocystis PSII preparations. Light-minus-dark EPR spectra (dark adapted for 4 min and illuminated at −9°C for 4 min) were obtained on manganese-depleted PSII preparations at pH 7.5 containing 3 mM ferricyanide and 3 mM ferrocyanide (dotted line) and, as a positive control, oxygen evolving PSII preparations containing three equivalents of ferricyanide (solid line). (D) Decay of tyrosine D• EPR signal in Synechocystis PSII preparations. Tyrosine D• EPR spectra were recorded every 4 min; spin quantitations via double-integration of each spectra were plotted as a function of time. Data plotted are from wild type (closed circles), HQ189D2 (crosses), HL189D2 (filled diamonds), HL189D2 after imidazole reconstitution (open diamonds), HL189D2 after 4-methylimidazole reconstitution (open triangles), and wild type after imidazole reconstitution (open circles). The first spectrum recorded 4 min after illumination was normalized to 100% for each data set. Best fits to the data points are shown in dotted lines.

