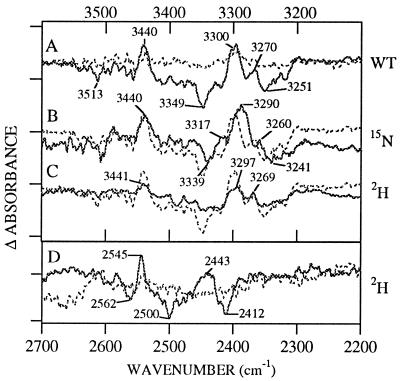
Figure 2.
Difference D• − D FT-IR spectra in manganese-depleted Synechocystis PSII preparations at pH 7.5. The spectra shown in solid lines were obtained from (A) wild type, (B) 15N-labeled wild type, and (C and D) 2H2O-exchanged wild type. Superimposed in the dotted line in A is a spectrum obtained from the YF160D2 mutant. Superimposed in the dotted line in B–D is the wild-type spectrum. Tick marks on the y axis correspond to 1 × 10⁻⁴ (Upper) and 2 × 10⁻⁵ (Lower) AU.

