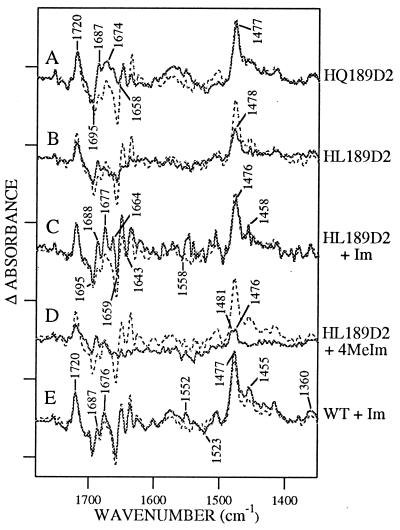
Figure 4.
Difference D• − D FT-IR spectra in manganese-depleted Synechocystis PSII preparations at pH 7.5. Spectra shown in the solid lines were obtained from (A) HQ189D2, (B) HL189D2, (C) HL189D2 after treatment with imidazole, (D) HL189D2 after treatment with 4-methylimidazole, and (E) wild type after treatment with imidazole. Superimposed in the dotted line in A–E is the wild-type spectrum. Tick marks on the y axis correspond to 2 × 10⁻⁴ absorbance units.

