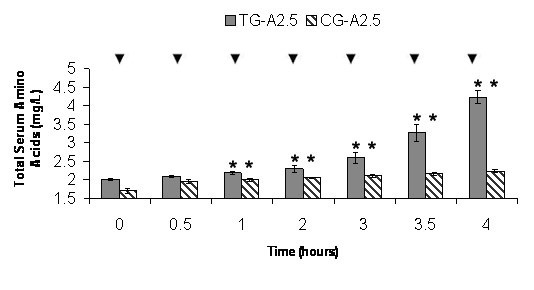
Figure 1.

CG-A2.5 and TG-A2.5 Average Total Serum Amino Acids (TSAA). Average levels of TSAA in Control Group (CG) A2.5 (n = 21) and Test Group (TG) A2.5 (n = 21). Values are means ± SEM. * Indicates significant change from baseline (p = 0.05). ▼ Indicates significant difference between groups (p = 0.05).
