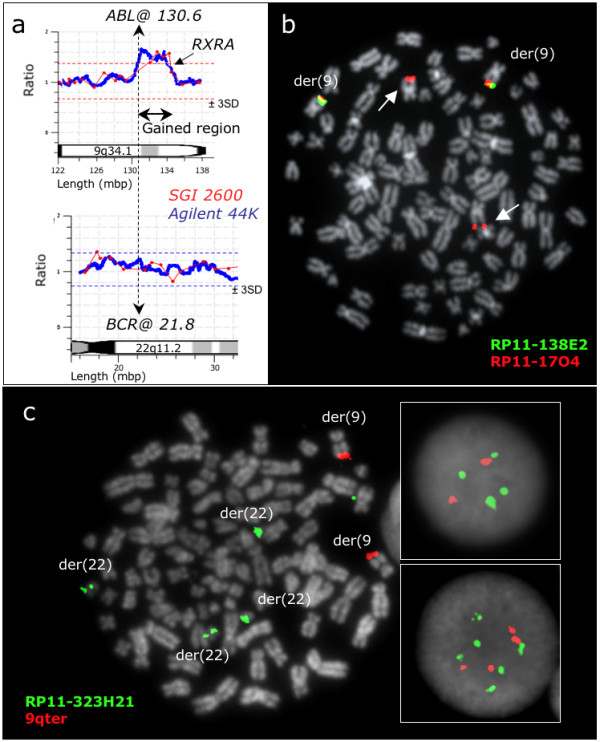
Figure 3.

Gains and deletions in the Ph negative BCR/ABL1 positive cell line CML-T1. (a) Array CGH reveals gains of sequences downstream of the ABL1 breakpoint. The genome profile of the 9q34.1-qter region is shown at the top and the 22q11.2-2 region is presented at the bottom, aligned at the ABL1 and BCR breakpoints (vertical dashed line). Results of the SGI2600 BAC chip are shown in red and 44 K Agilent oligonucleotide in blue. Both BAC and oligo array detect a gain of the 9q34 sequences proximally flanked by the ABL1 breakpoint and distally by the RXRA gene. (b) A representative tetraploid metaphase cell with co-hybridization of FISH probes RP11-138E2 and RP11-17O4, showing the proximal breakpoint of the 9q34 deletion arisen in this sub-clone (the arrows show the two missing green signals from RP11-138E2). (c) A representative tetraploid metaphase cell with co-hybridization of RP11-323H21 and a 9q sub-telomeric probe (Stretton), showing the duplication of the masked Ph and that the genomic loss affects not the der(9) but the "normal" homologue (the 2 green and 2 red signals from the two normal 9 are missing). The top box on the right shows 4 green, 2 red signals as seen in interphase tetraploid cells with deletion, while the bottom box on the right shows 6 green, 4 red signals as seen in the interphase tetraploid cells without deletion.
