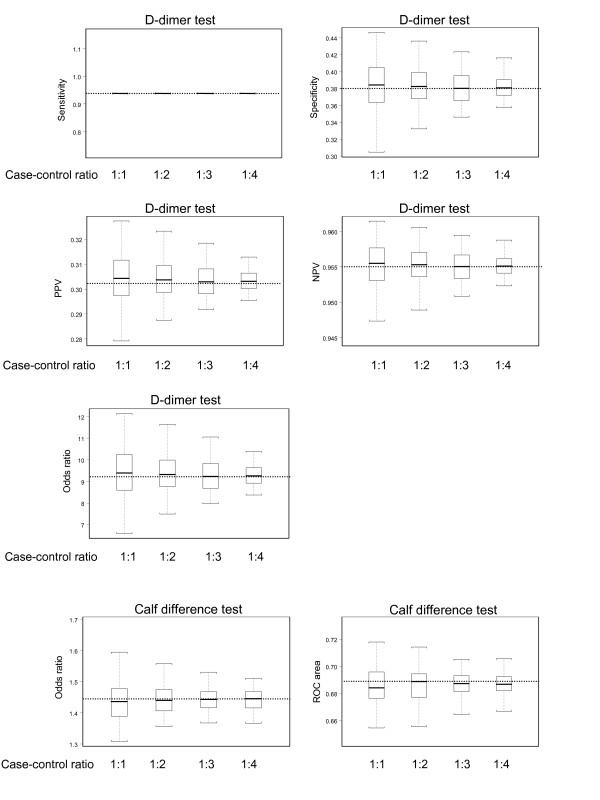
Figure 2.
Estimates of diagnostic accuracy of the D-dimer test and calf difference test for the 100 nested case-control samples with case-control ratios ranging from 1:1 to 1:4. The boxes indicate mean values and corresponding interquartile ranges (25th and 75th percentile). Whiskers indicate 2.5th and 97.5th percentiles. The dotted lines represent the values estimated in the full study population.

