
Figure 1.
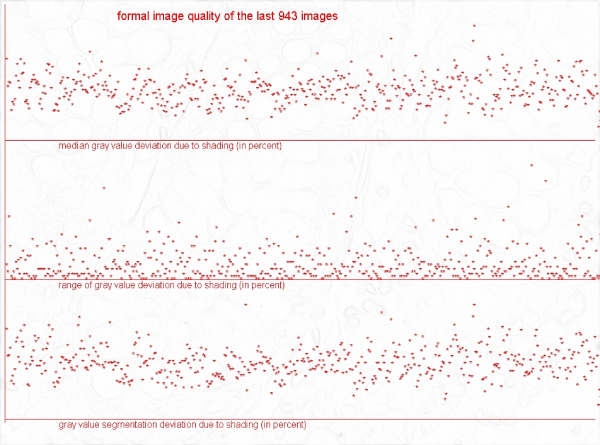
Gray value levels of shading correction of a total of 943 images, in percent. a) median grey value (upper line), b) grey value range (medium line), c) grey value segmentation deviation (lower line).
Official websites use .gov
A
.gov website belongs to an official
government organization in the United States.
Secure .gov websites use HTTPS
A lock (
) or https:// means you've safely
connected to the .gov website. Share sensitive
information only on official, secure websites.
Gray value levels of shading correction of a total of 943 images, in percent. a) median grey value (upper line), b) grey value range (medium line), c) grey value segmentation deviation (lower line).