Figure 2.
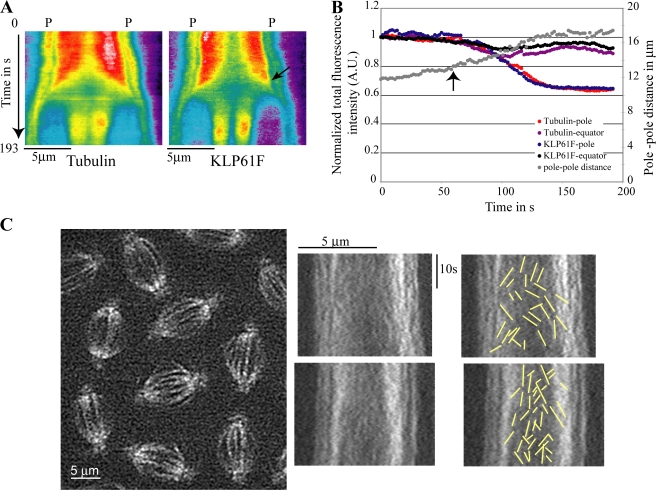
Kymography and FSM of KLP61F-GFP dynamics. (A) Kymographs of tubulin and KLP61F distribution from mid-metaphase (0 s) until telophase. In anaphase B, KLP61F moves toward the spindle equator before tubulin. Kymographs show the mean total intensity per pixel along the pole (P)–pole axis. Red and dark blue indicate the highest and lowest intensity, respectively. (B) Plot of normalized integrated fluorescence intensity of KLP61F and tubulin within a 2-μm-wide region along the pole–pole axis of the same spindle near the pole and equator during the preanaphase B–to–anaphase B transition (0 s = late metaphase). Arrows in A and B indicate anaphase B onset, i.e., when chromatids have separated and the spindle elongates at a characteristic linear rate (from 13 to 17 μm). (C, left) A frame from an FSM video showing KLP61F-GFP speckles on spindles. Kymographs from same video (center) display many speckles as “dots” rather than lines, which indicates transient binding of KLP61F to spindle MTs. (right) Tracings (overlaid on kymograph) showing a subset of speckles that appear as lines due to KLP61F motility (see text).

