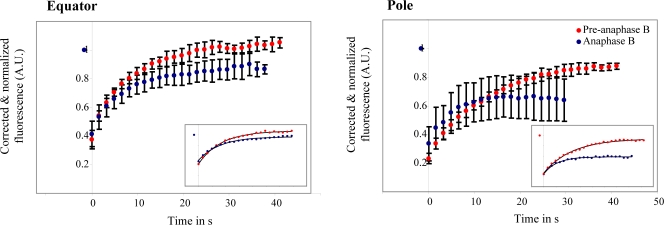
Figure 3.
FRAP analysis of KLP61F-GFP in D. melanogaster embryo spindles. KLP61F turns over rapidly. Plots show corrected (see Materials and methods) normalized fluorescence recovery of a 2-μm-wide region at the equator and pole during preanaphase B and anaphase B. (insets) Representative plots for individual experiments. Each curve was fitted with a single exponential (black line). Error bars represent standard deviation (see Table I).

