Figure 2.
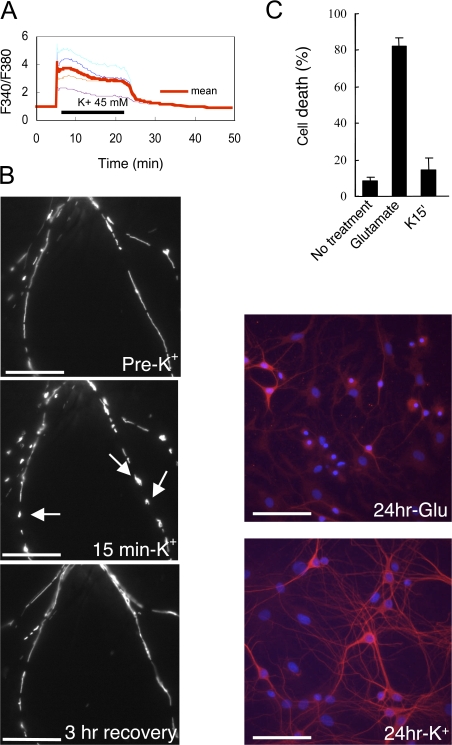
High K+ induces elevation in intracellular Ca2+ and reversible changes in mitochondrial morphology. (A) Intracellular Ca2+ level was measured in hippocampal neurons (12 DIV) in response to treatment with 45 mM K+. Graphs show normalized ratios of F340/F380 in four different neurons (thin lines) and the mean value (bold line). (B) Neurons transfected with pDsRed2-Mito were analyzed before addition of 45 mM K+ and 15 min after treatment with high K+. Arrows show ringlike mitochondria formations. After 15 min, 45 mM K+ was removed by exchange of media, and mitochondria were imaged after 3 h. The same result was obtained in three separate experiments (n = 3). Bars, 10 μm. (C) Neurons (12 DIV) were untreated or treated for 15 min with 500 μM glutamate or 45 mM K+. After the 15-min treatment, the media was replaced by conditioned medium from 10-d-old neuronal cultures. 24 h later, cell death was measured by Hoechst 33258 and MAP2 staining. Data were obtained from at least five visual fields under a 20× objective from at least three independent experiments for each group. Error bars indicate SEM in each group. Bars, 40 μm.

