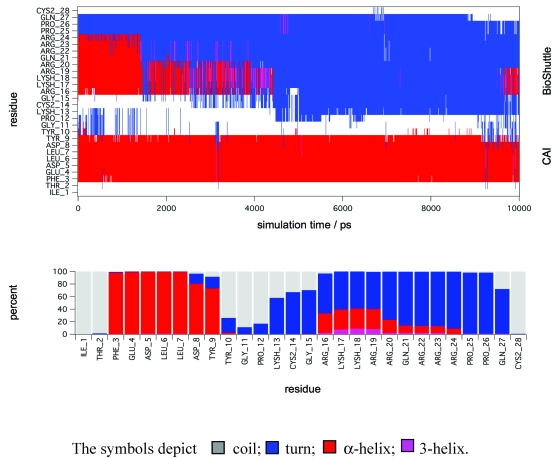
Figure 6.
Molecular dynamic simulations. The figure shows a secondary structure analysis of a 10 ns MD simulation of CAI-BioShuttle. BioShuttle looses helical structure (shown in red) after about 2 ns simulation time and prefers a 'turn'–like (blue) orientation of the backbone torsions for the rest of the simulation time (top). Statistics of the secondary structure motifs per residue (bottom) showing that the probability for α-helical structure is low for the BioShuttle whereas the α-helical properties of the CAI moiety are very high.

