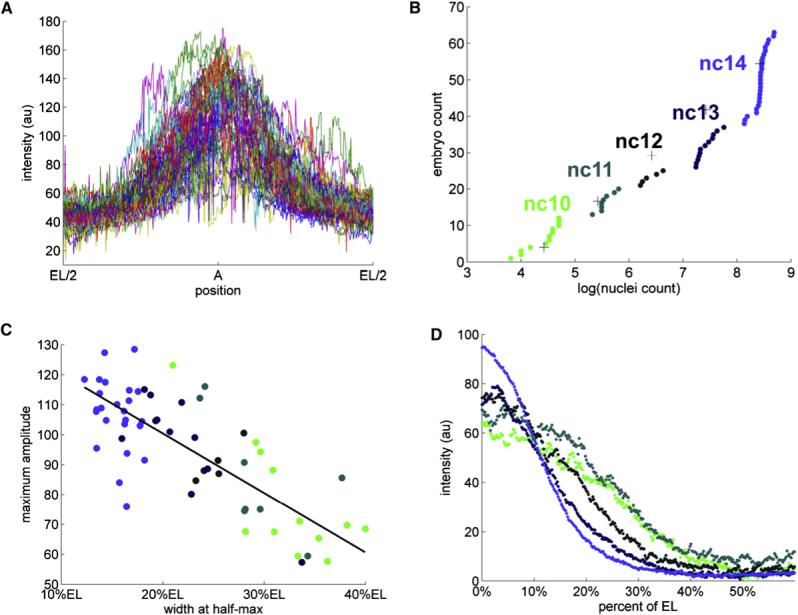
Figure 3. Dynamics of the Wild-Type dpERK Gradients.

(A) Superposition of the unnormalized anterior dpERK gradients from a collection of 63 embryos. Even though the fixation, staining, and imaging conditions for all of these embryos were identical, the raw intensity profiles varied considerably. The spatially averaged variability was ∼80%, almost an order of magnitude greater than the variability associated with imaging of a single embryo (see Supplemental Data for details).
(B) Cumulative distribution function (c.d.f.) of nuclear densities from the same collection of embryos. Clear breaks in the c.d.f. correspond to the consecutive doublings in the number of syncytial nuclei. Different colors denote five temporal classes of embryos, corresponding to the nuclear cycles 10, 11, 12, 13, and 14. See Supplemental Data for details of clustering of embryos according to their nuclear densities.The absolute value of nuclei count correspond to the number of nuclei in a fixed window size (see Figure S3 for details).
(C) A significant fraction of high variability is explained by the dynamic changes of the dpERK profiles over consecutive nuclear divisions. The heights and widths of the unnormalized gradients are anticorrelated; in addition, both of these parameters are correlated with the nuclear density. In this image, each embryo is represented by a circle, colored according to its nuclear cycle.
(D) A gradient normalization procedure, applied to the embryos that have been grouped according to their age, reveals that the anterior gradients get progressively “taller” and “thinner” as the nuclear density increases. The dpERK profiles from the same temporal classes are strikingly similar (mean spatial variability of 6.9% for nuclear cycle 14). For example, the profiles from cycle 14 embryos are as similar as the ones obtained by repetitive imaging of the same embryo (mean spatial variability of 6%). See Supplemental Data for the details of normalization procedure.
