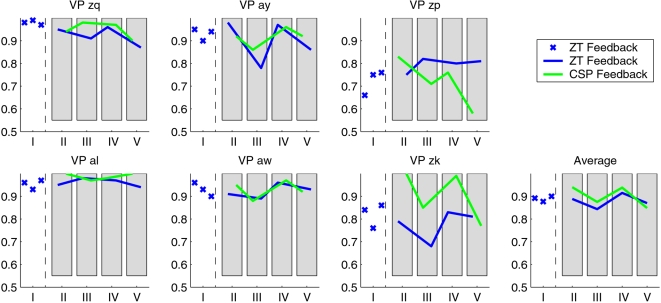
Figure 4. The feedback results for each of the six subjects.
The feedback accuracy is denoted for the 100 trials of each run. The initial three runs, here marked as block “I”, were done with the Zero-Training classifier, and in the following the order of the classifiers was randomly permuted in each block of two runs, here denoted as “II–V”. The shift of the blue curve relative to the green curve within the shaded areas indicates the order of the classifiers within the block.

