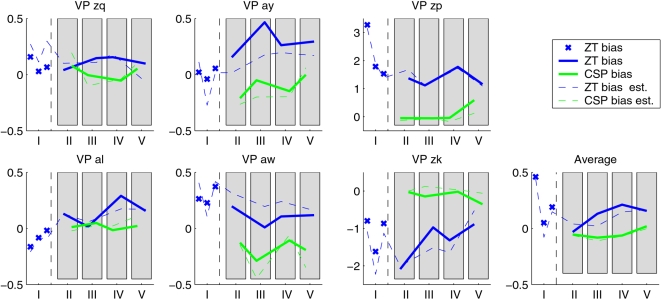
Figure 6. At the beginning of each run, the bias for the classifier was adapted using 10 trials per movement imagination class.
The plot shows the optimal bias update, as calculated on the following 100 trials. This value is normalized by the difference between the classifier output class means. The solid lines show the optimal bias for CSP (green) and Zero-Training (blue) classifier separately. The dashed lines indicate the bias, as it was actually calculated on the initial 20 trials by the adaptation procedure during the feedback.

