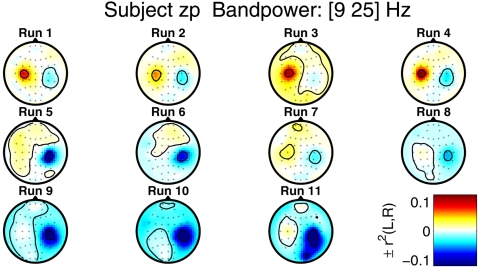
Figure 10. For each feedback run of the session, this figure shows the scalp topographies of class discriminability of band power features for subject zp.
After bandpass filtering to the frequency band of 10–25 Hz, the log-bandpower was calculated for each electrode in the window 500–3000 ms after the presentation of the stimulus. Finally, signed r 2-values were calculated as a measure of class discriminability.

