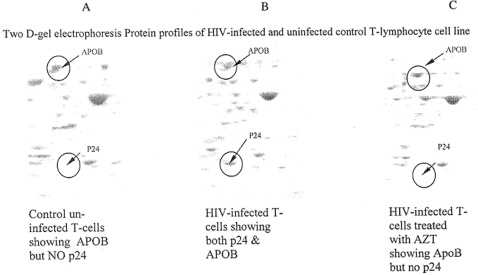
Figure 5. Figure 5: Two-dimensional gel electrophoresis patterns of HIV-infected and counterpart uninfected cells T-cells.
Protein profiles were evaluated 48 hours after treatment with azidothymidine (AZT), or mock treatment with phosphate buffered saline. Figure 5A represents protein profile of uninfected T-cells and shows theexpression of Apolipoprotein B-100 (APOB) and the absence of HIV p24 antigen. Figure 5B represents the protein profile of HIV-infected T-cells and displays the presence of both APOB and p24 antigen. Figure 5C indicates that APOB is NOT inhibited by treatment of HIV-infected cells by AZT while the viral proteins are inhibited by the antiviral drug.

