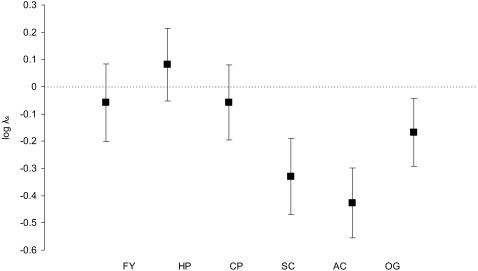
Figure 3. Habitat-specific stochastic population growth rates (log λs) for the six habitat types.
FY: farmyard, HP: horse pasture, CP: cattle pasture, SC: spring-sown crops, AC: autumn-sown crops, OG: other ungrazed grassland. Log λs was estimated from 10000 simulations of log λ. Error bars show the standard deviations of estimates of log λ resulting from temporal environmental variances.

