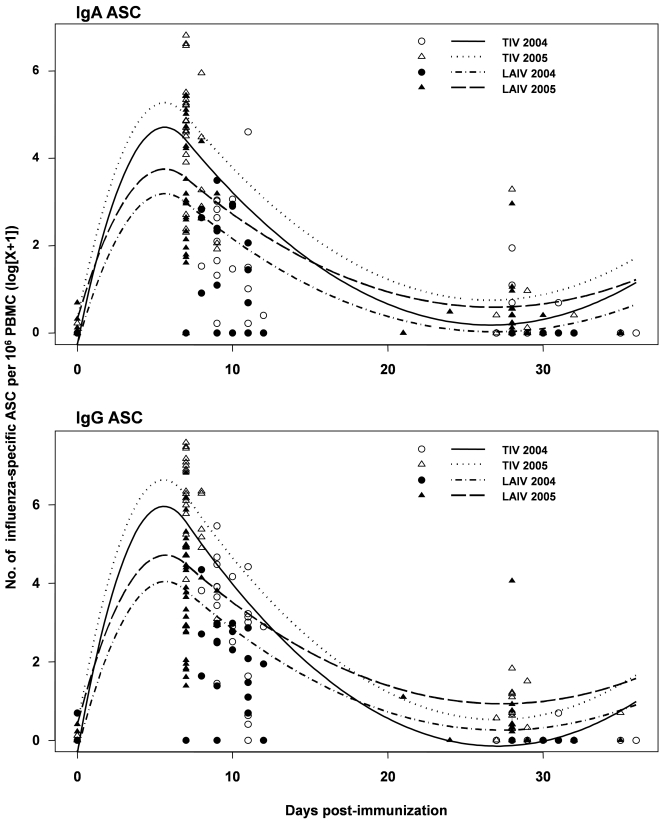
Figure 3. Kinetics of effector IgA and IgG ASC responses after TIV or LAIV vaccination.
Plotted is the frequency of influenza-specific effector IgA and IgG ASC as a function of days after TIV or LAIV vaccination for the 2004 and 2005 studies. Observed data are plotted as circles and triangles. Lines provide the fit of the GEE regression model. Of interest was comparing the difference in the slopes of these fitted lines over days 7–11 post-vaccination between TIV and LAIV. Regression analysis assumed that this difference between TIV and LAIV did not depend on year (2004 vs. 2005).

