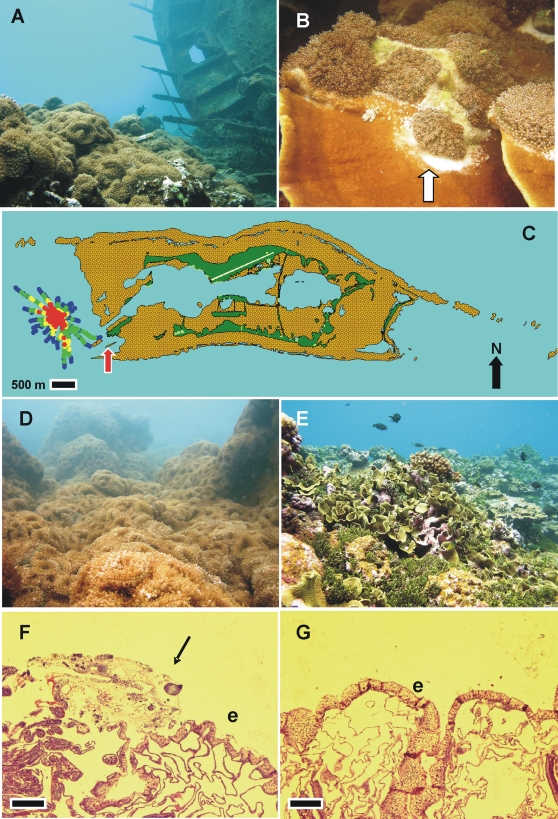
Figure 1. Invasion of the western shelf of Palmyra by corallimorphs from macro to micro scale.
A) Shipwreck (right) and monoculture of R. howesii (left). B) Close up of Montipora capitata overgrown with R. howesii, note acute tissue loss where corallimorph has retracted (arrow). C) Extent of corallimorph infestation on western shelf of Palmyra Atoll NWR. Color codes dots correspond to estimated benthic cover of corallimorphs: red = high (>60%), yellow = medium (>30–60%), green = light (1–30%), blue = no visible corallimorphs. The ship is at the center of the red zone. Red arrow points to area where buoys were surveyed (Penguin Spit). The dark green area on the map represents emergent land with air strip (yellow line), and the brown area is submerged plateau surrounded by reef crest. D) Monoculture of R. howseii near ship. E) Unaffected reef. F) Photomicrograph of Acropora sp. with R. howesii-induced tissue loss manifesting tissue fragmentation and necrosis (arrow); e-epidermis, bar = 200 µm. G) Photomicrograph of normal Acropora sp.; e-epidermis, bar = 200 µm.

