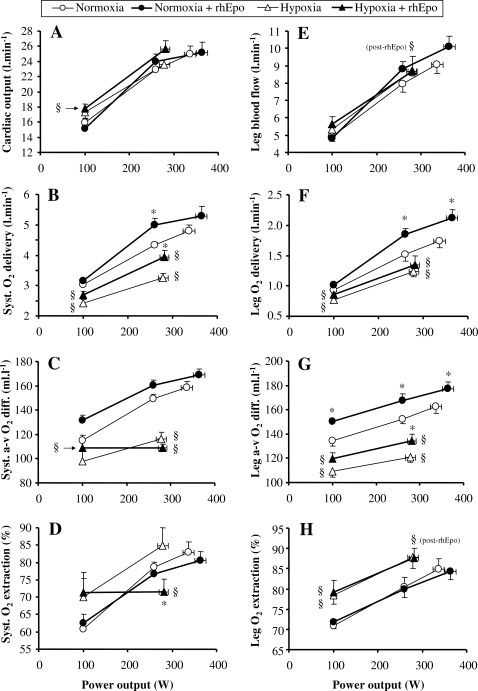
Figure 6. Systemic and leg O2 transport variables after rhEpo in normoxia and in severe acute hypoxia.
This figure refers to the invasive study. Cardiac output (panel A), systemic O2 delivery (panel B), systemic arterio-venous O2 difference (Syst. A-v O2 diff.) (panel C), systemic O2 extraction (panel D), leg blood flow (panel E), leg O2 delivery (panel F), leg arterio-venous O2 difference (Leg a-v02 diff) (panel G) and leg O2 extraction (panel H) are plotted against power output in the four experimental conditions, i.e. before and after a 14-week treatment with recombinant human erythropoieitin (rhEpo) during normoxia and acute hypoxia equivalent to an altitude of 4500 m. Values are means±SE in seven subjects. *P<0.05 after vs before rhEpo. §P<0.05 hypoxia vs normoxia.

