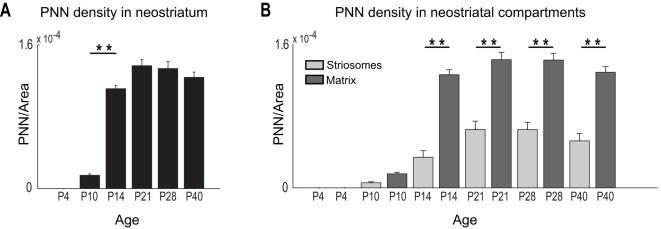
Figure 7. PNNs overlap selectively with the neostriatal matrix in postnatal mice.
(A) PNN density increases significantly between P10 and P14 within the entire neostriatum; after P14, PNN density levels off and remains consistent into adulthood (one-way ANOVA, Tukey-Kramer test; F(5, 48) = 142.14, P<<0.00001). Bar indicates significant increase in PNN density between P10 and P14. (B) PNN density is significantly greater in matrix compared to striosomes for all ages after P14 (Two-way ANOVA, age and subregion as factors; F(5, 96) = 112.8, P<<0.00001 across ages; F(1, 96) = 236.62, P<<0.00001 across subregions; F(5, 96) = 20.15, P<<0.00001 for interactions between age and subregion). (**) indicates significance levels of P<<0.00001.

