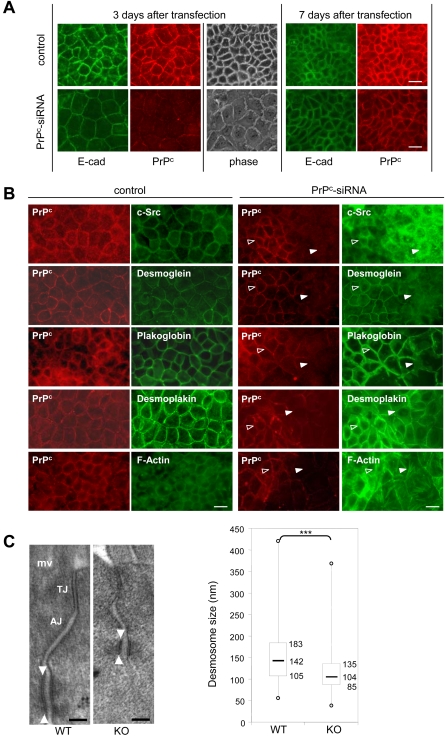
Figure 5. Effects of PrPc invalidation on the sub-cellular localization of junctional PrPc partners and on desmosome structure.
(A): Caco-2/TC7 cells were transfected by PrPc-siRNA 3 days after seeding and the expression and localization of PrPc (red, 12F10 antibody) and E-cadherin (green) were analyzed 3 days and 7 days after transfection in control (Oligofectamine or mouse PrPc-siRNA transfected cells) or human PrPc-siRNA transfected cells. Phase contrast image (phase) shows the morphology of the cell layer. (B): Immunofluorescence labeling of PrPc (red), c-Src, desmoglein, plakoglobin, desmoplakin and F-actin (green) was performed in control cells (left panels) and in human PrPc-siRNA transfected cells 3 days after transfection (right panels). Control pictures are representative of the results obtained with scramble siRNA or with mouse PrPc si-RNA or with cells incubated with the transfection agent, Oligofectamine. In human PrPc-siRNA transfected cells, fields combining zones where PrPc was still present (open arrowhead) and zones where it was switched off (closed arrowhead) are shown. Note the difference in cell shape between both areas. Mouse 12F10 anti-PrPc antibody was used for immunofluorescence labeling of PrPc except for co-labeling with plakoglobin, in which rabbit polyclonal anti-PrPc Ab703 antibodies were used. Bar: 20 µm. (C): Desmosomes were analyzed by electron microscopy in intestinal epithelium sections from PrPc knock out (KO) and wild type (WT) mice. Note the electron-dense desmosomal plaque which was shorter in PrPc-knock-out than in wild type mice (arrowheads). mv: microvilli, TJ: tight junction, AJ: adherens junction. Bar: 100 nm. Quantification of desmosome size was represented in the lower graph. Box and whisker plots show median desmosomal length (horizontal line), 25th and 75th centiles (box), and range (whiskers) in the wild type (WT, n = 135, three mice) and PrPc-knock out mice (KO, n = 135, three mice), ***p<0.001.

