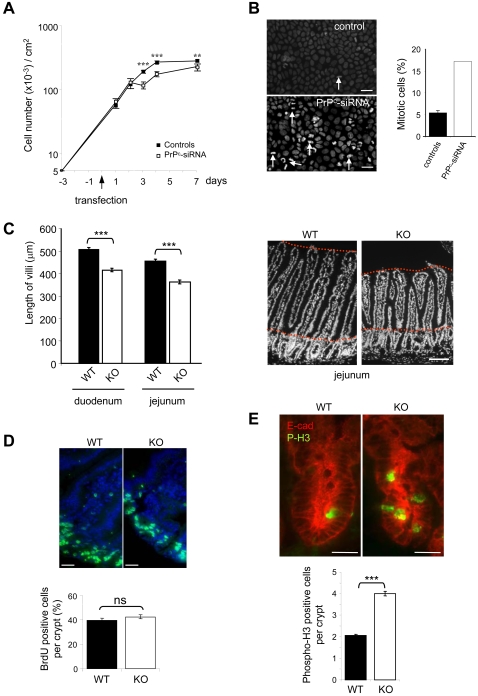
Figure 6. Effects of PrPc invalidation on the completion of cell division and length of intestinal villi.
(A): Caco-2/TC7cells were numbered all along the experiment from 3 days before transfection (−3) to 7 days after transfection. Controls combine results obtained in the three conditions described in figure 5 (scramble siRNA, mouse PrPc si-RNA, Oligofectamine). PrPc-siRNA condition corresponds to the results obtained after specific human PrPc-siRNA transfection. Results are from 4 independent experiments. **p<0.01, ***p<0.001. (B): In the same experiments, cells that showed nuclear division phases were counted after staining with DAPI. In the left panels arrows point examples of metaphases or telophases that were counted. In each condition, 1000 cells were analyzed and the percentage of mitotic cells in controls (black bar, same three conditions as above) or in human PrPc-siRNA (white bar) transfected cells is reported in the right panel. Error bar shown in histogram of controls represents the statistical analyses performed when combining the three control conditions. C: sections of duodenum and jejunum fragments from wild type (WT) and PrPc knock out (KO) mice (2 mice in each group) were stained with DAPI (right panel, bar: 100 µm). Sixty villi were measured for each mouse and fragment. No difference was observed between the 2 mice of each group (not shown), but significant differences (***p<0.001) were obtained between wild type (black bars) and knock out mice (white bars) in both duodenum and jejunum fragments. (D): After 1.5 hour BrdU intraperitoneal injection, sections from the jejunum fragment of wild type (WT) and knock out (KO) mice were performed. Nuclei were visualized with DAPI staining (blue). BrdU-stained proliferating cells (green) are limited to the crypts in wild type and knock out animals. Bars: 10 µm. Knock out mice display similar number of positive BrdU cells per crypt as compared with wild type mice (quantification in the right panel graph). No significant difference was revealed by statistical analysis (ns, student's t test). (E): Immunofluorescence analyses of phospho H3 (green) and E-cadherin (red) were performed on intestine sections from wild type (WT) or PrPc knock out (KO) mice (3 mice in each group). Pictures of crypt staining are shown (upper panels; bars: 10 µm) and the number of phospho-H3 positive cells per crypt is reported (155 crypts were counted in each group). ***p<0.001.

