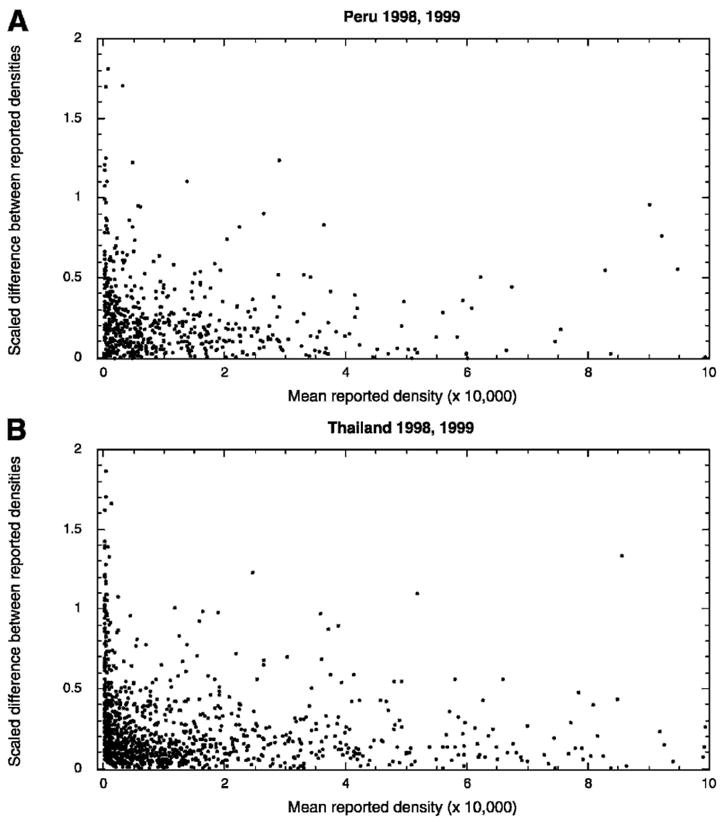
Figure 1.

Variability between density measurements of two independent microscopists. Scaled differences (density A − density B)/mean (density A + density B) plotted against the mean of A and B show an inverse relationship between density and discrepancy for readings of two different microscopists examining the same slide. Data were collected in Peru (top panel) and Thailand (bottom panel).
