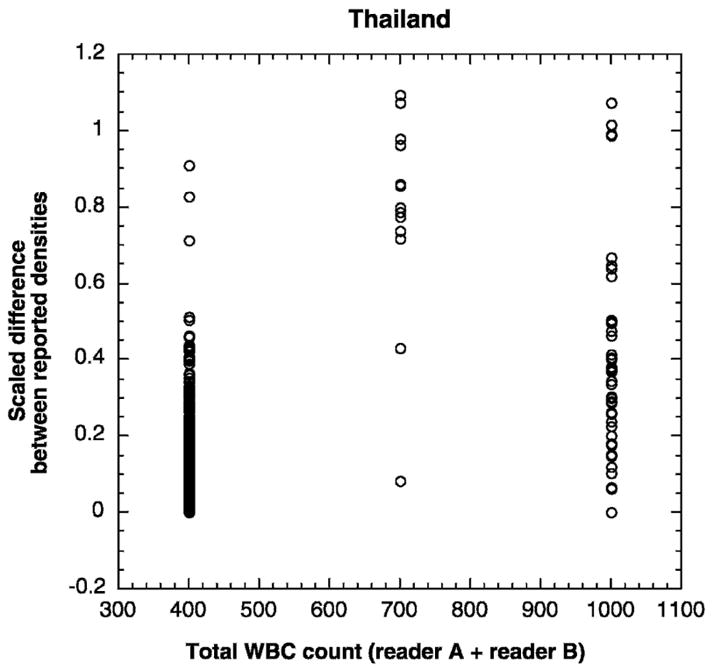
Figure 2.

Variability between density measurements of two independent microscopists as a function of total white blood cells (WBCs) indexed by the microscopists. Scaled differences are plotted as a function of the sum of the WBCs counted by both microscopists A and B. Differences between readings were significantly higher when the microscopists counted different numbers of WBCs (total WBCs = 700).
