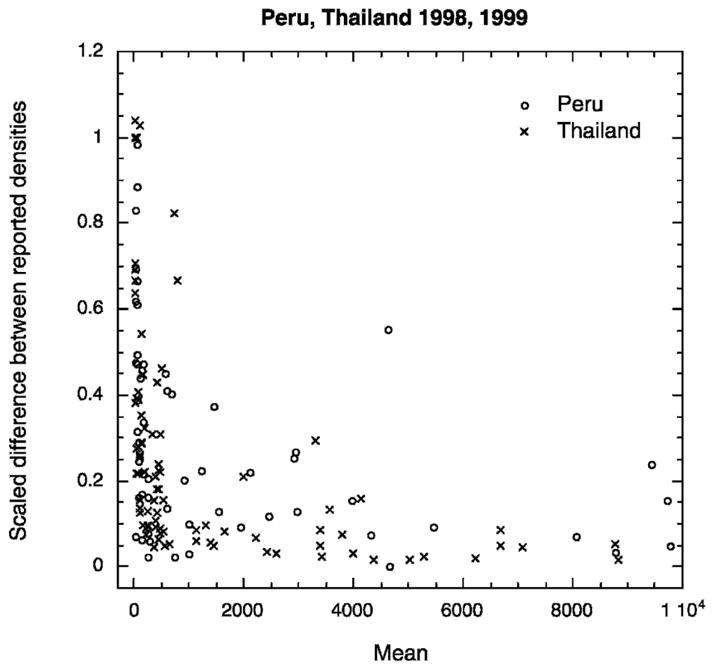
Figure 3.

Variability between density measurements from the same microscopist reading two slides prepared from the same patient. Scaled differences between readings from two different slides read by the same microscopist plotted as a function of the mean of the two counts shows a trend of decreasing variability with increasing parasite density.
