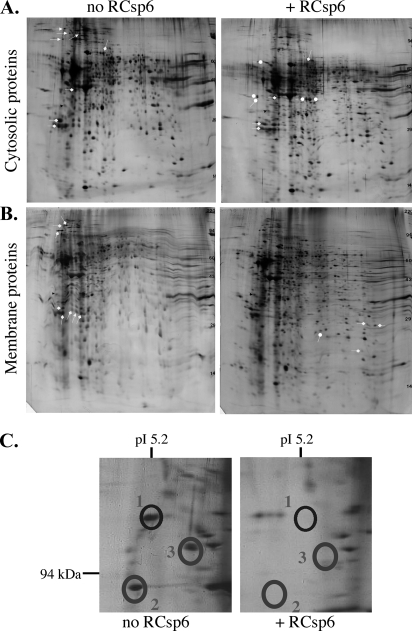
Fig. 2.
Two-dimensional gel analysis of Csp6-cleaved proteins. Shown is a comparison of 2D gels: non-digested (no RCsp6) versus RCsp6 (+RCsp6)-digested proteins extracted from the cytosolic (A) and membrane (B) subcellular fractions. Spots that disappeared with RCsp6 are labeled with an arrow, spots that decreased with RCsp6 are labeled with a block arrow, and spots that increased with RCsp6 are indicated with a rounded arrow. C, high magnification of some of the spots that disappeared (encircled) shown in A.

