Figure 3.
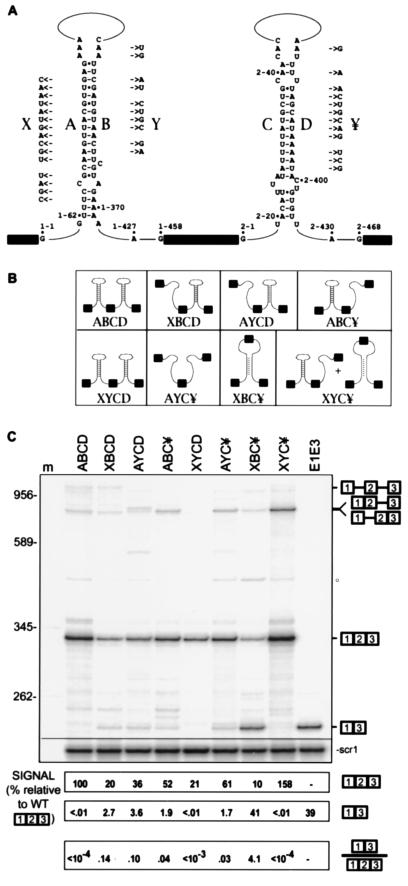
Intron self-complementarities ensure exon-inclusion. (A) Sequences of intron complementarities and mutant derivatives. Intron complementarities between regions downstream of the 5′ splice site and upstream of the branchpoint in introns 1 and 2 (designated A/B and C/D, respectively), and their predicted secondary structures. Additional secondary structure is predicted for the regions internal to each intron (data not shown). Mutations (X, Y, and ¥) that replace intron complementarities are shown next to the affected element. Complementarity exists between X/Y and between X/¥. For each intron, 5′ and 3′ splice site guanosine and branchpoint adenosine residues are indicated. Intron sequences are numbered 1–1 through 1–458 for intron 1, and 2–1 through 2–468 for intron 2. (B) Predicted effect of the mutations on substrate secondary structure. Presence or absence of pairing is shown schematically for each construct. (C) Splicing phenotypes of the mutant constructs. Splicing was analyzed by reverse transcription of total cell RNA using a 5′-labeled (32P) primer complementary to CUP1 sequences. Lane m, DNA size markers. E1E3 is a marker for exon skipping expressed from a construct in which exons 1 and 3 are directly fused. Expected products are diagrammed at the right. The different unspliced pre-mRNAs are indicated by an asterisk (∗). Spliced products were measured relative to scr1; the amount of exon included mRNA in wild type was taken as 100%.

