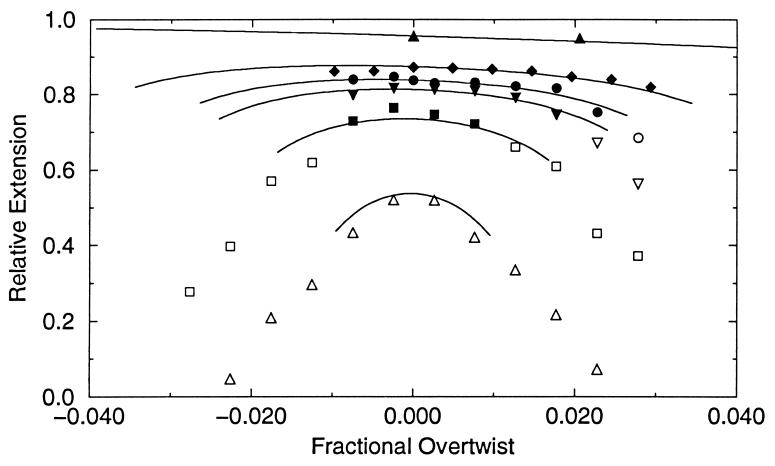
Figure 1.
Relative extension of lambda-DNA versus applied force f and overtwist σ. From top to bottom, the curves are at fixed force 8.0, 1.3, 0.8, 0.6, 0.3, and 0.1 pN. The dots are experimental data from figure 3 of ref. 10, excluding values of f, σ where the DNA is known to denature by strand separation. Open dots are outside the range of validity of the phantom chain model and were not used in the fit. The corresponding points from figure 2 of ref. 10 also were used in the fit (not shown), for a total of 49 points. The lines are our theoretical predictions after fitting to A, C, and D (see text).

