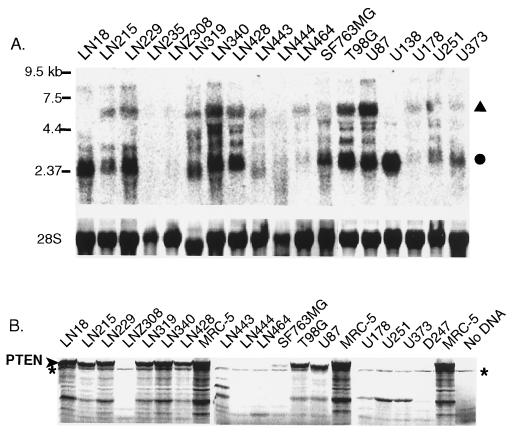
Figure 1.
PTEN expression and PTT mutation detection in glioma cell lines. (A) Northern blot analysis of PTEN. Major 5.5-kb (▴) and 2.5-kb (•) transcripts are indicated. (Lower) Relative levels of RNA loading are shown as methylene blue staining of 28S RNA. (B) 35S-labeled proteins generated by PTEN PTT. ∗ indicates a nonspecific background product that is present in all lanes. Full-length PTEN is indicated at left.

