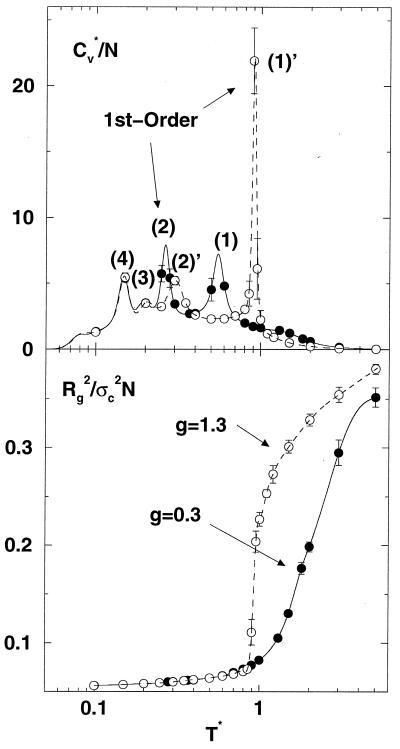
Figure 2.
The reduced heat capacity, Cv* (= Cv/kB) and the reduced squared radius of gyration per bead, Rg2/σc2N, as a function of temperatures. The lines in Cv* curves are obtained from the weighted histogram method (10, 15). The lines in Rg2 (dashed line, g = 1.3; solid line, g = 0.3) are from a spline fit. Error bars are less than the size of points excepted as shown.

