
Figure 5.
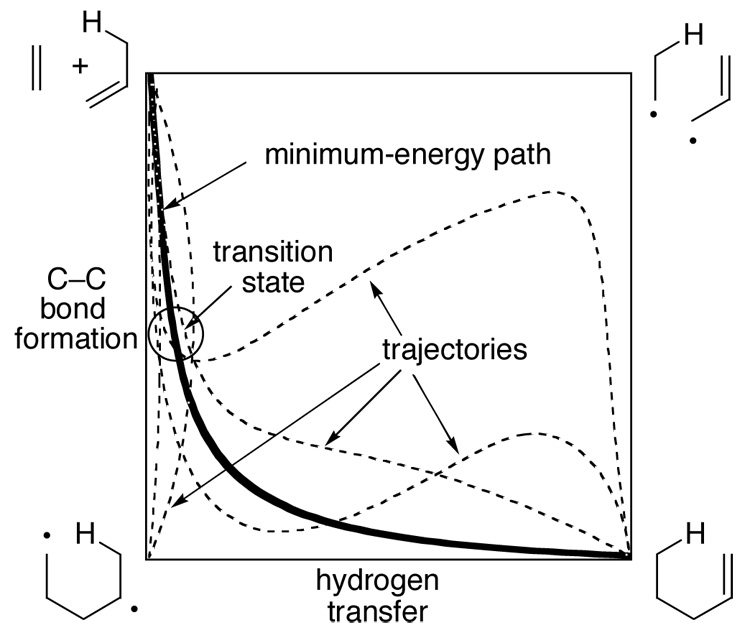
More O'Ferrall-Jencks diagram for ene reactions. The approximate minimum-energy path expected for reaction of 9 or 16 is shown as a solid bold line. Possible qualitative trajectories are shown as dotted lines.
Official websites use .gov
A
.gov website belongs to an official
government organization in the United States.
Secure .gov websites use HTTPS
A lock (
) or https:// means you've safely
connected to the .gov website. Share sensitive
information only on official, secure websites.
More O'Ferrall-Jencks diagram for ene reactions. The approximate minimum-energy path expected for reaction of 9 or 16 is shown as a solid bold line. Possible qualitative trajectories are shown as dotted lines.