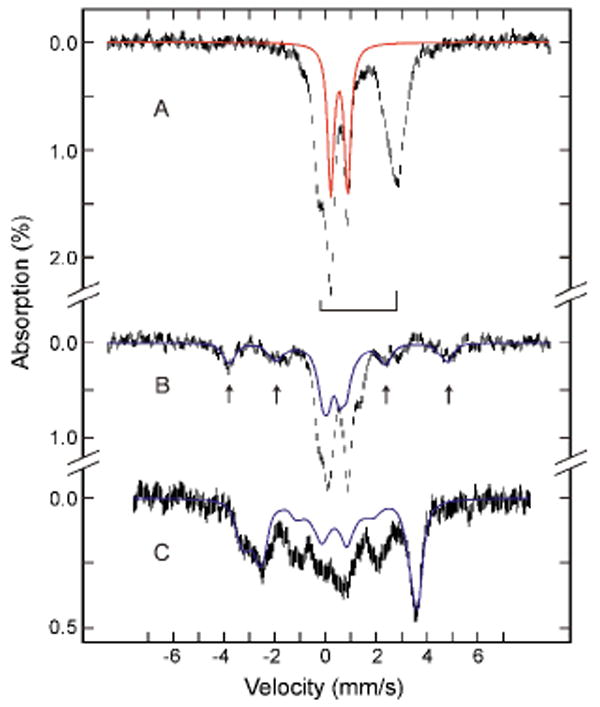
Figure 2.

Mössbauer spectra of samples freeze-quenched at 70 ms (A) and 3.5 s (B and C) in the reaction of diiron(II) I100W ToMOH with O2. The data were recorded at 4.2 K in a parallel applied field of 50 mT (A and B) or 8 T (C). For the spectra in B and C, the diiron(II) contributions (50% of the total Fe absorption) were removed from the raw data for clarity. Simulated spectra of the peroxo intermediate (A, red line) and of the X-Y• species in R2-W48F (B and C, blue lines) are superimposed and scaled to 30% of the total absorption of that sample. The bracket (A) indicates the diiron(II) protein. Raw data are denoted as vertical bars.
