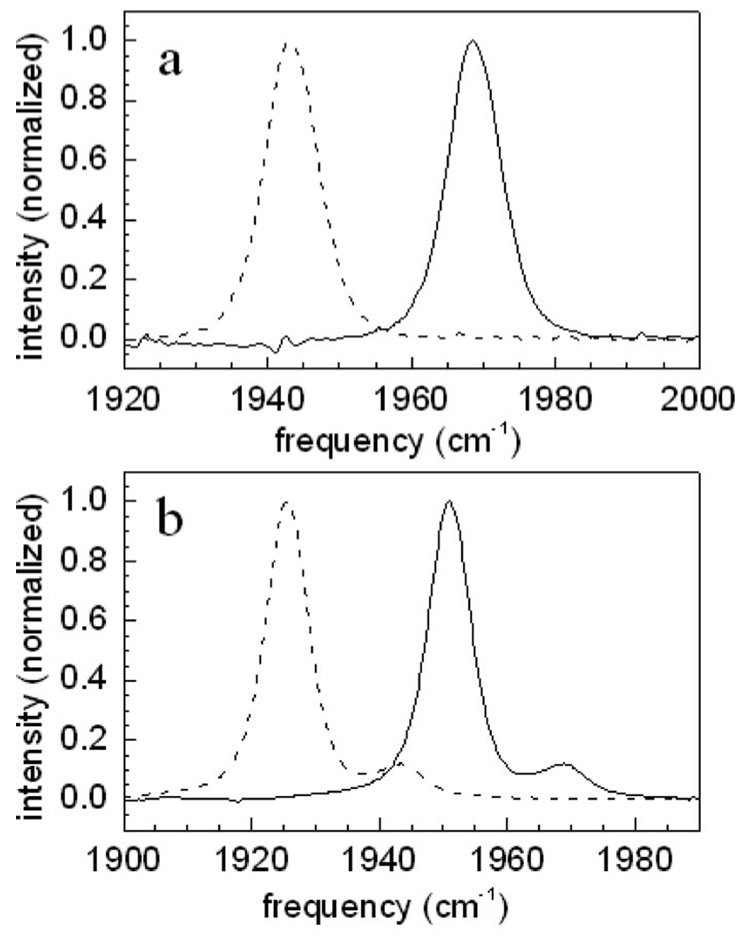
FIG. 2.
FTIR absorption spectra. (a) H64V–CO 0-1 absorption (solid curve) and the 0-1 absorption shifted to lower energy by 25 cm−1 to model the 1-2 absorption (dashed curve). (b) Hb–CO 0-1 absorption (solid curve) and the 0-1 absorption shifted to lower energy by 25 cm−1 to model the 1-2 absorption (dashed curve). Note that the Hb–CO spectrum has a main band and a small band to the blue of the main band. The 1-2 transition of the blue band overlaps the 0-1 transition of the main band.

