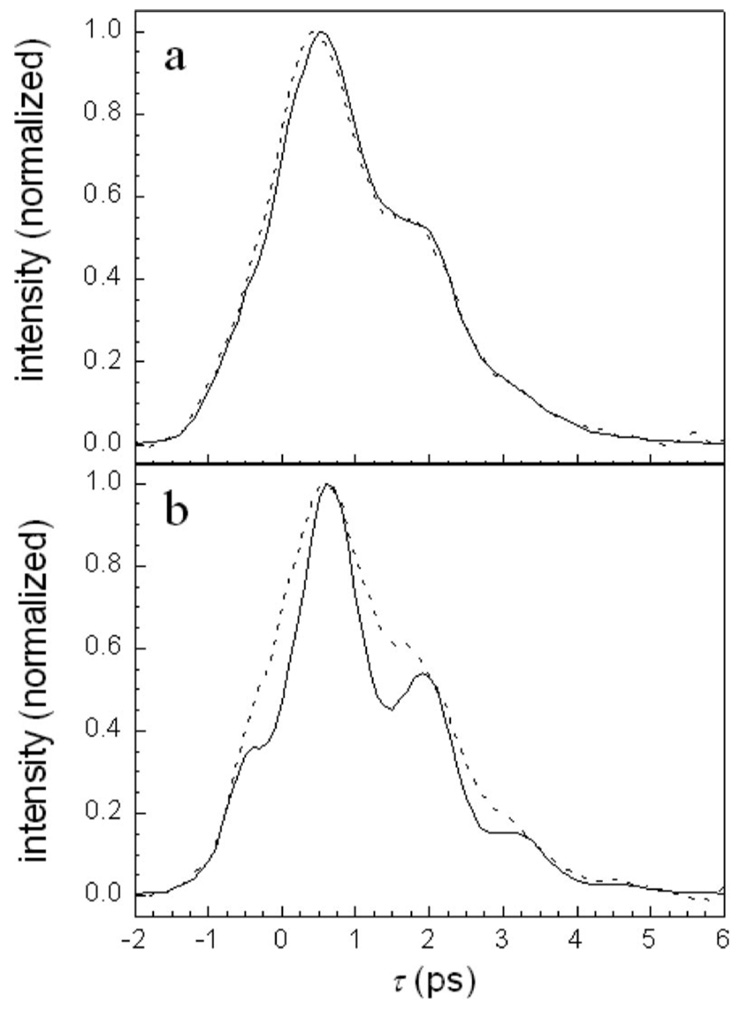
FIG. 3.
(a) Hb–CO vibrational echo decays detected at the 0-1 transition frequency. Solid curve—high intensity. Dashed curve—low intensity. Note the intensity independent beats. (b) Hb–CO vibrational echo decays detected at the 1-2 transition frequency. Solid curve—high intensity. Dashed curve—low intensity. Note the pronounced oscillations on the 1-2 transition at high intensity that are substantially reduced at low intensity.

